
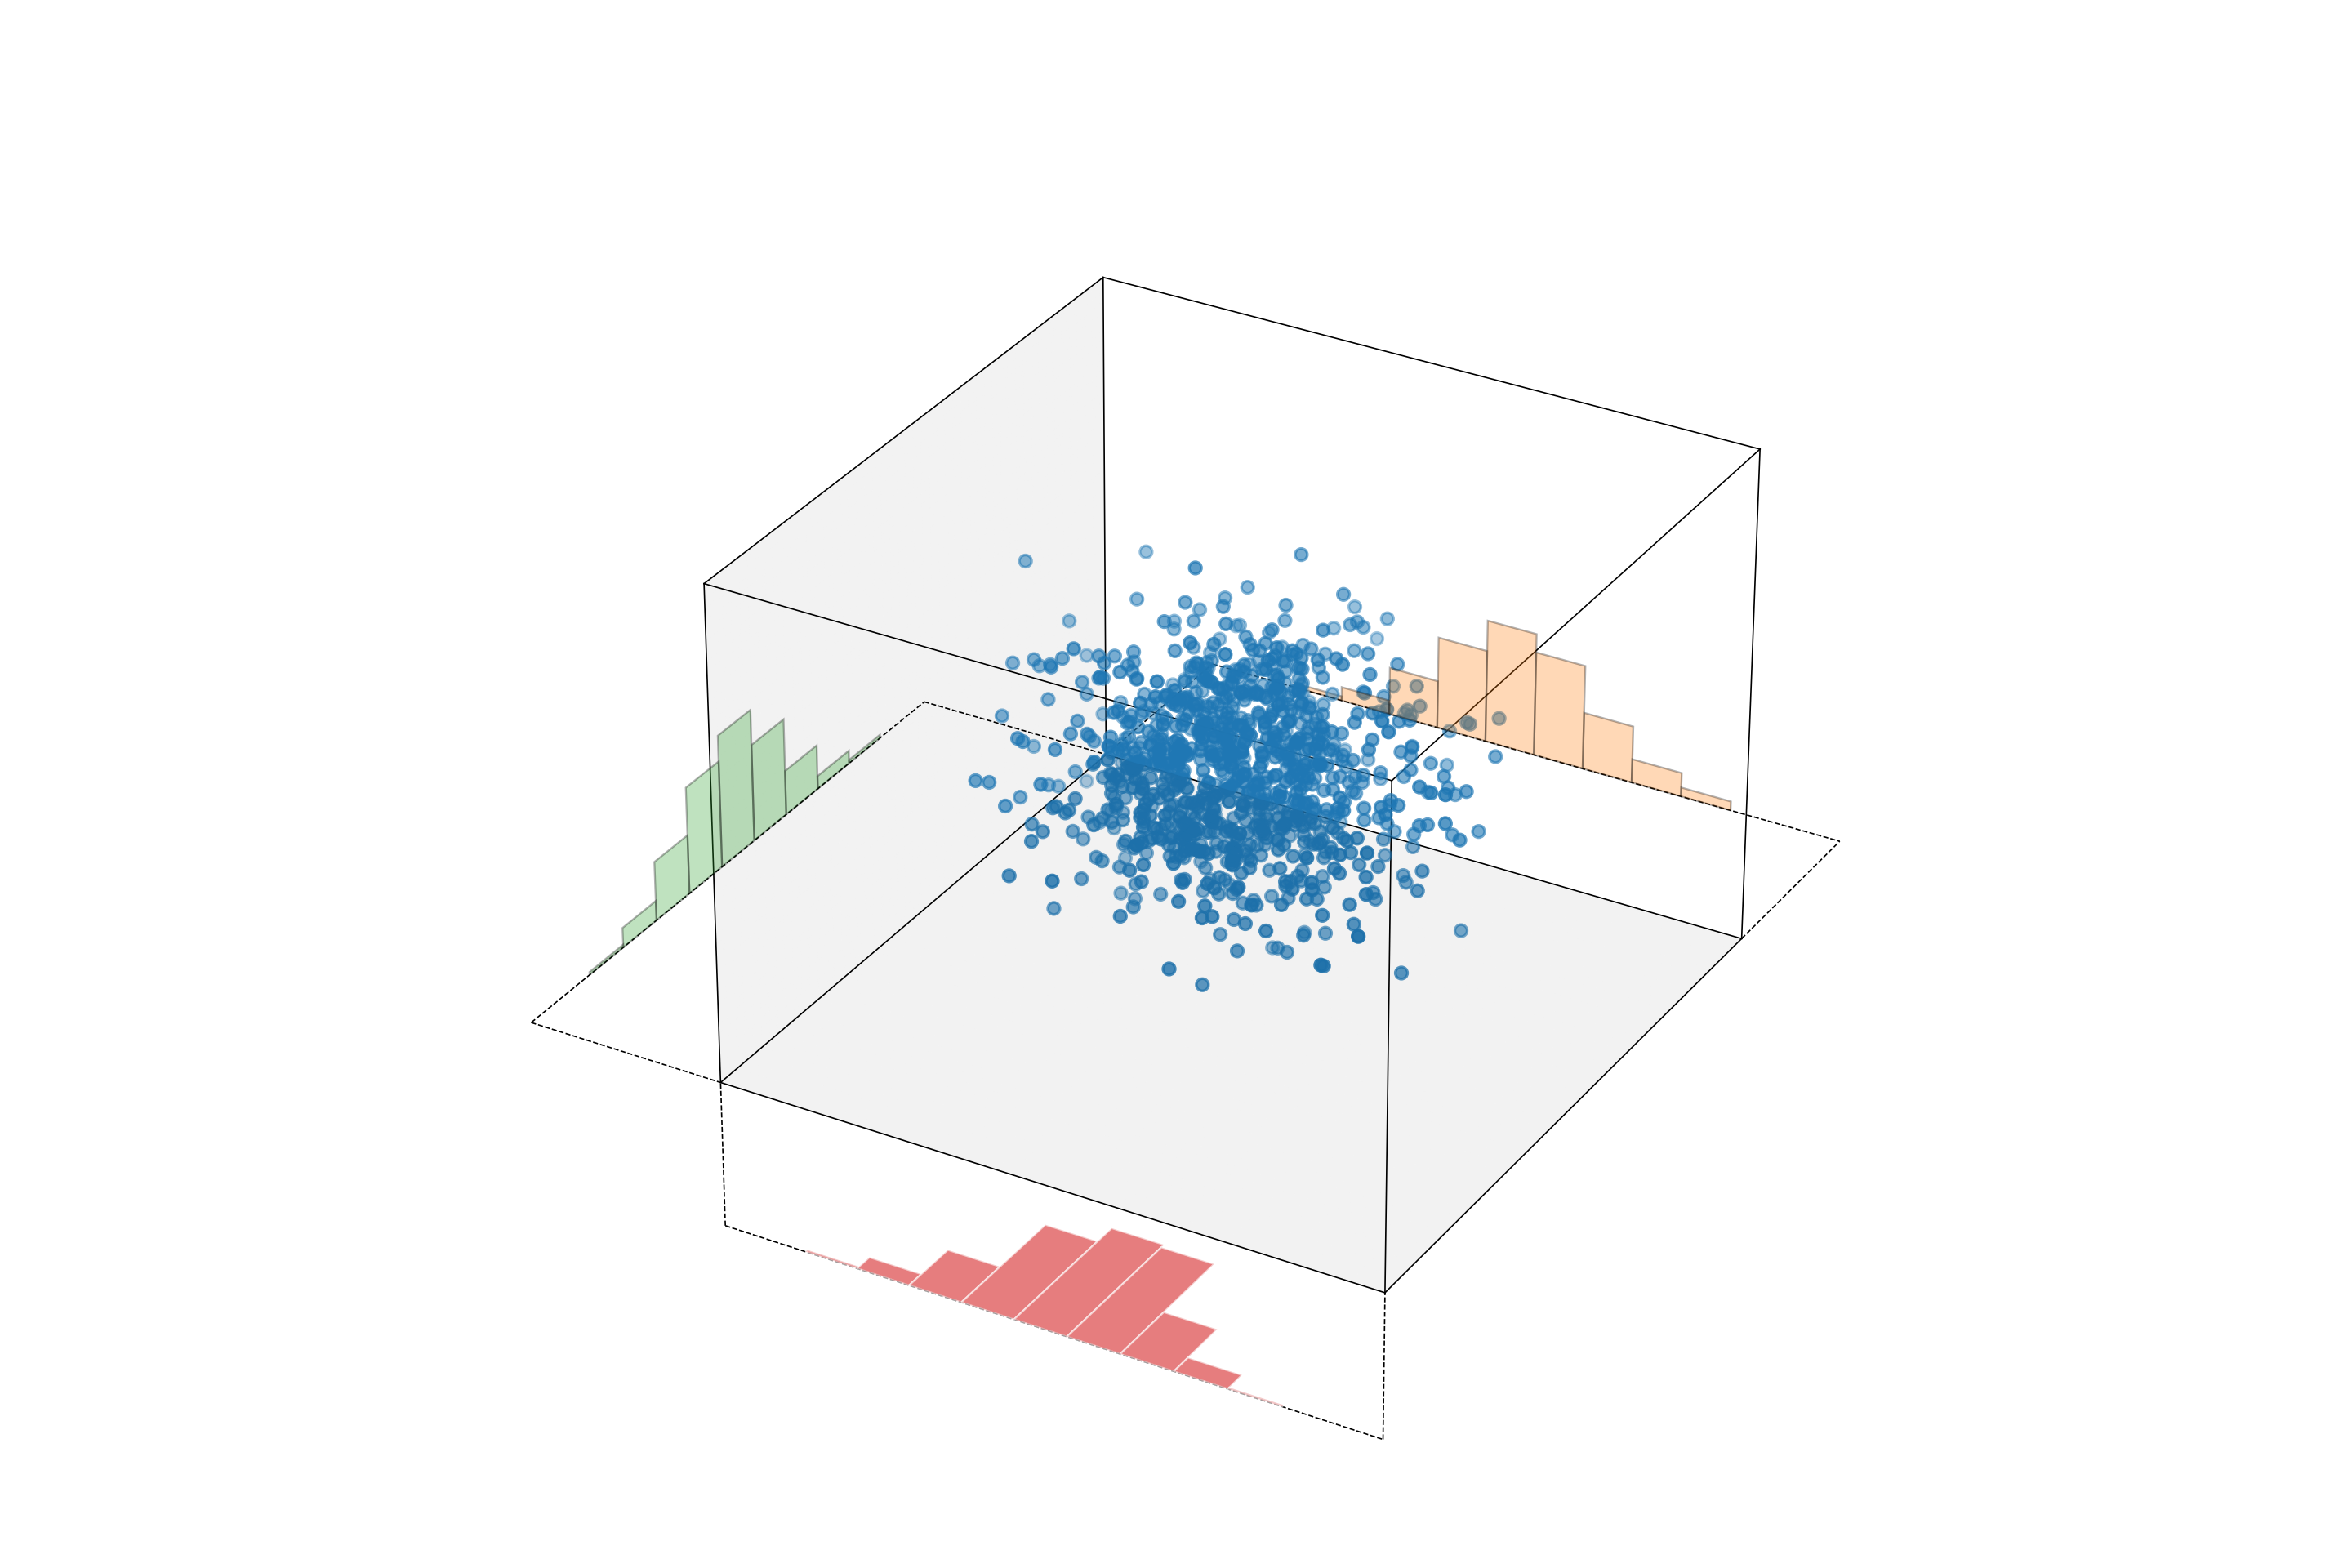
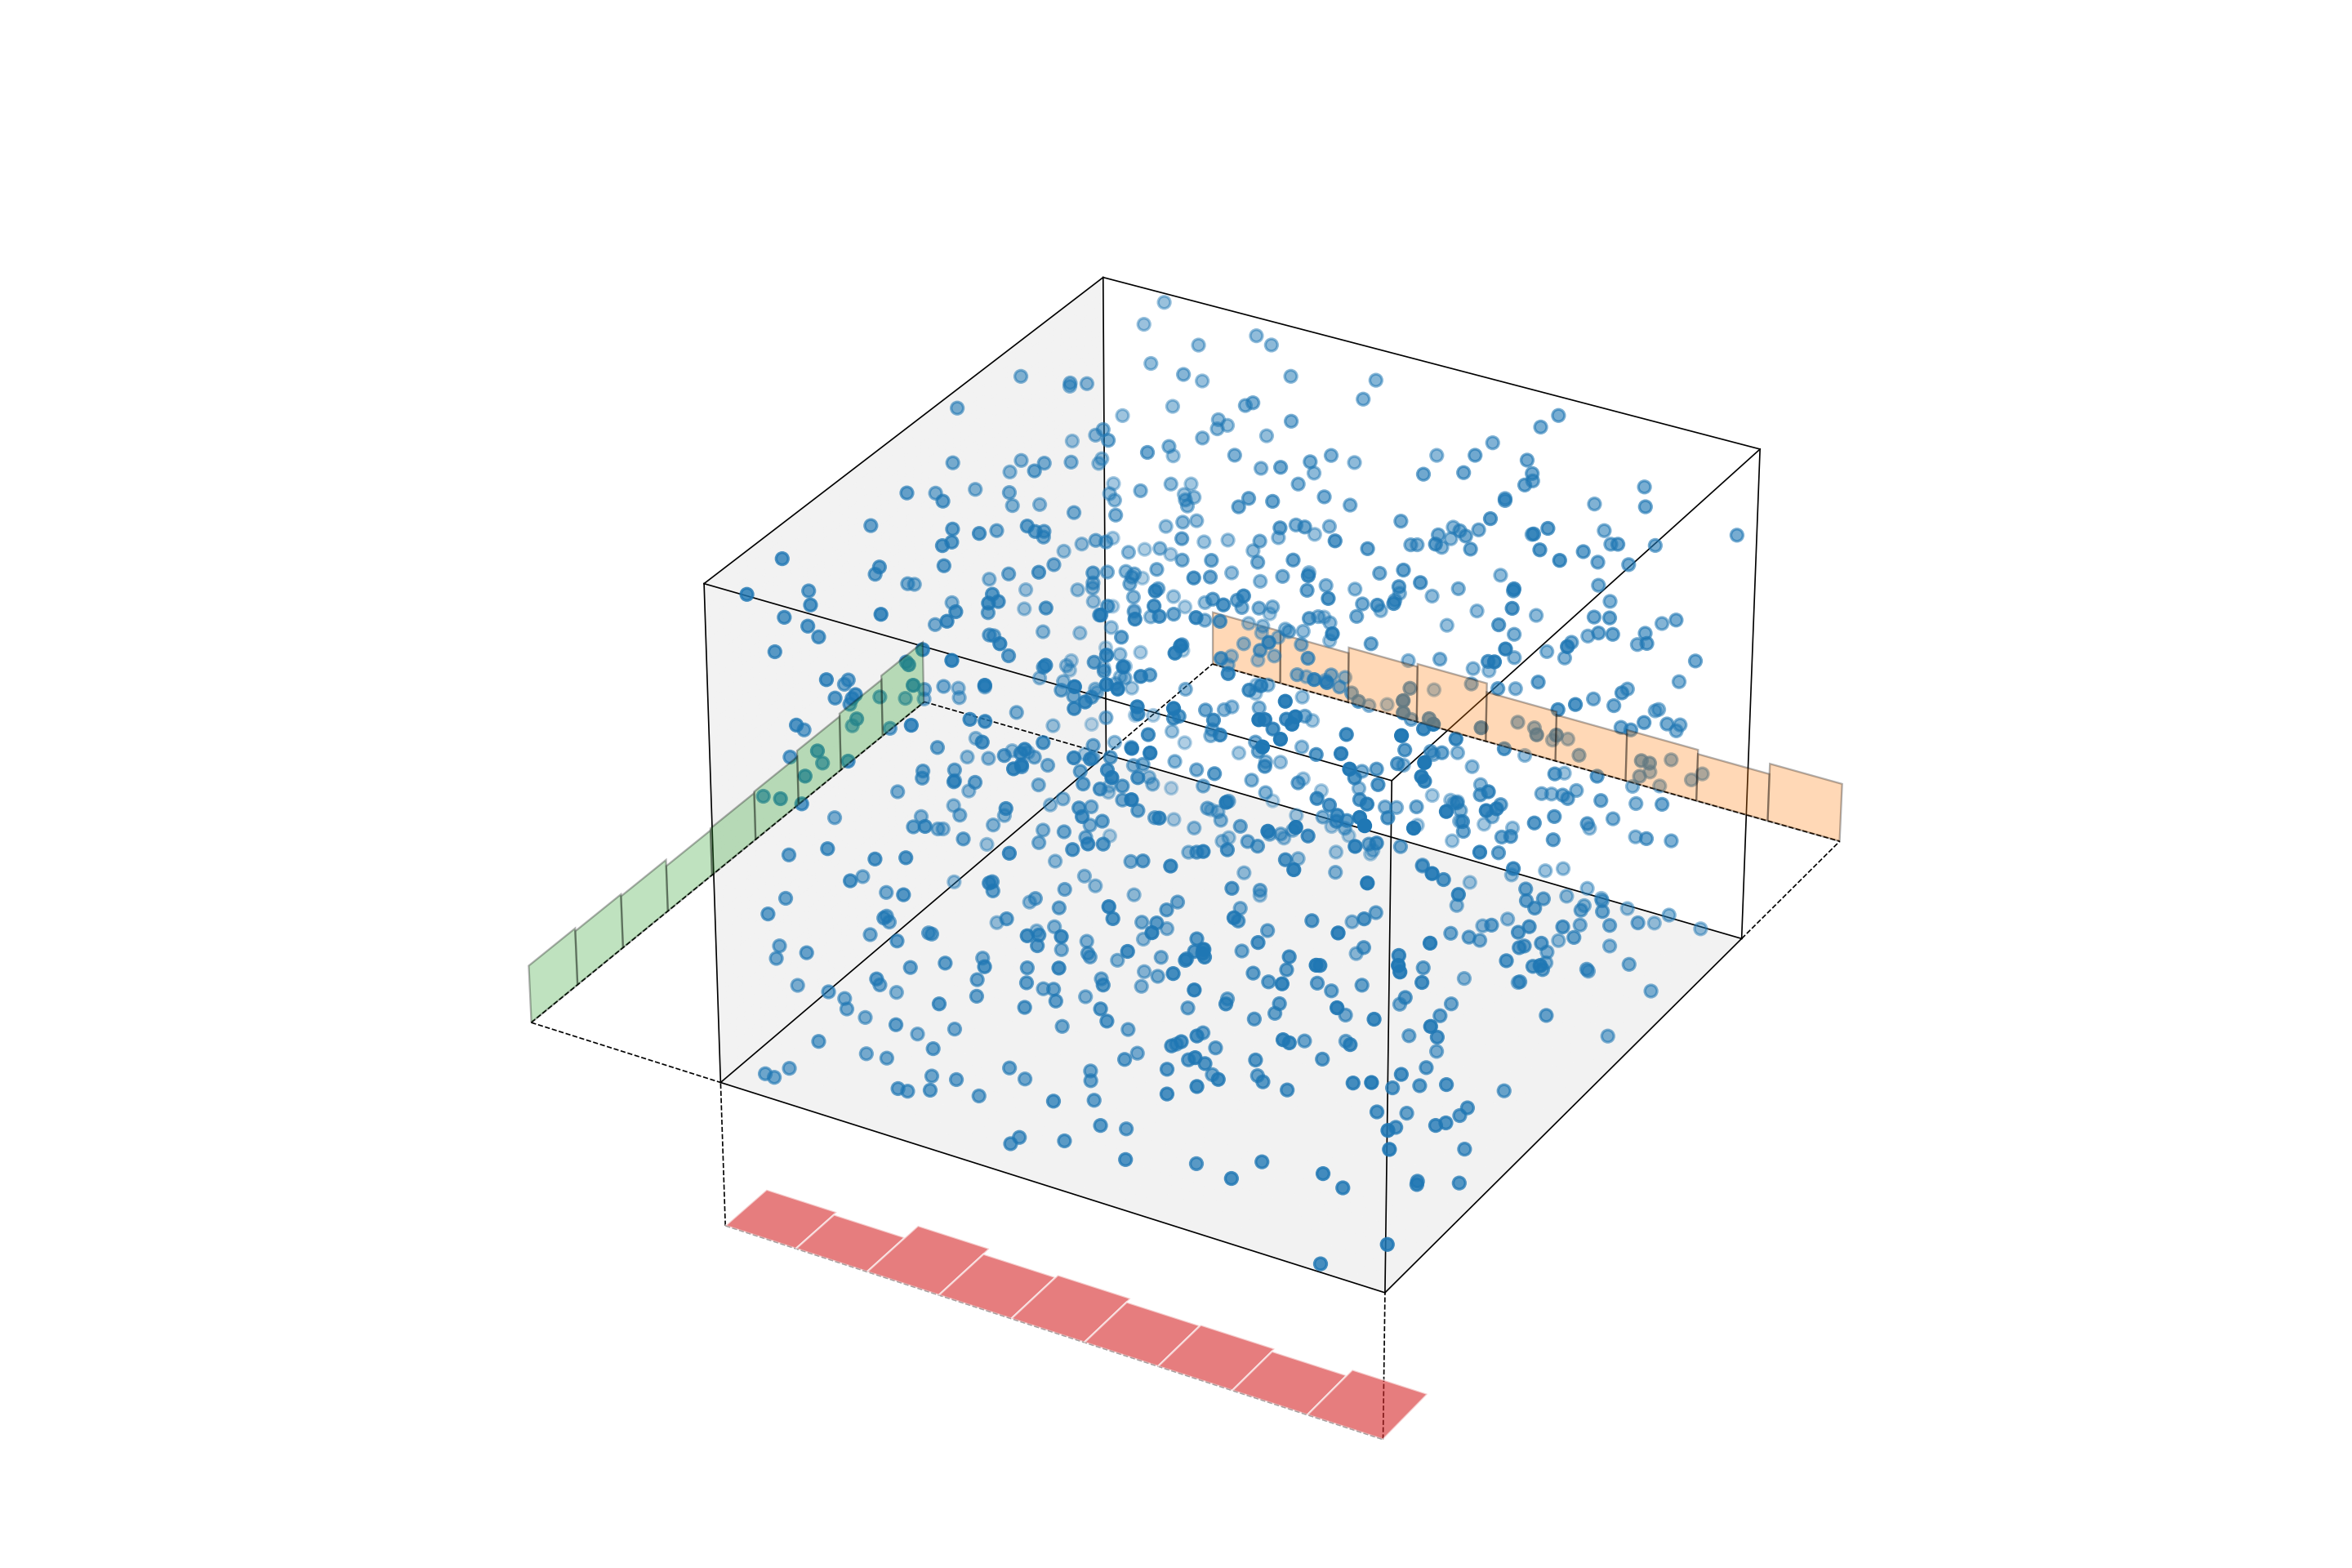
This is a first attempt to plot 3D scatter plot and their histograms along the x, y and z directions independently in different axes. The plots obtained using matplotlib module using Python.
For the x and y directions, the histograms work fine but along the z-direction it doesn’t work the way I wanted. However, this is a good attempt to achieve this (at least partially).

Here is the code to achieve the above plots: They are not cleaned at this point – refactoring can improve the quality of the code considerably.
Keywords: “3d axes scatter plot with 2d plots”, “3d scatter plot with 2d histograms”, “matplotlib 3d scatter and 2d histogram”, “matplotlib python 3d axes 2d plots”, “3d and 2d plots together matplotlib”, plotting histograms on 3D axes with Python, matplotlib 3d plot and tied 2d plot as another axis, matplotlib overlay 2d plot in a 3d axis, matplotlib plot bar 2d on 3d axes, matplotlib 2d bar plot on 3d z axes. How to plot a 3D looking barchart using Matplotlib in a 2D environment? 3d scatter plot with histograms in 2D dimensions?
import numpy as np
import matplotlib.pyplot as plt
from mpl_toolkits.mplot3d import Axes3D
from scipy.stats import qmc
from dataclasses import dataclass


def auto_close_matplotlib_plots():

    # if not args.noplots:
    # To keep them open for multiple run call the run via &, e.g. `python pythonraytrace/websplitting.py &`
    plt.show(block=False)
    # print("Here")
    plt.pause(0.001)
    input("\nHit [enter] to close matplotlib plots")

    return

def save_snapshots_to_file(
    save_figs: bool = True, filename: str = "snapshotfile"
) -> None:
    """
    Save the snapshots in time to file
    Note that for (16,9) sized figure, dpi=120 gives (16,9)*120 =[1920,1080] pixels png file
    Similarly, dpi=240 gives (16,9)*240 =[3840,2160] pixels png file (4K)
    """

    if save_figs:
        # n = ARGS.npoints - ARGS.npoints%100
        # OutFolder = 'Snapshots_{n}'
        # if not os.path.exists(OutFolder):
        #     os.mkdir(OutFolder)

        # outpngfilename = f"{OutFolder}/{filename}_{ARGS.npoints}_ARGS.markersize}.png"
        # plt.savefig(outpngfilename, facecolor='w', dpi=240)
        plt.savefig(filename, facecolor="w", dpi=240)

    else:
        plt.show()

    return


def plot_x_and_y_place_surfaces(Eox, Eoy, Lz3, ax, alpha=0.1):

    z = np.linspace(0, Lz3, 100)
    y = np.linspace(0, Eoy, 100)
    Z, Y = np.meshgrid(y, z)
    X = np.zeros(Z.shape)
    # ax.plot_surface(X, Y, Z, alpha=0.1, color="green")
    ax.plot_surface(X, Y, Z, alpha=alpha, color="black")

    x = np.linspace(0, Eox, 100)
    y = np.linspace(0, Lz3, 100)
    X, Y = np.meshgrid(x, y)
    Z = np.zeros(X.shape)
    # ax.plot_surface(X, Y, Z, alpha=0.1, color="red")
    ax.plot_surface(X, Y, Z, alpha=alpha, color="black")


def plot_rectangle_border_lines(x0, x1, y0, y1, z0, z1):
    plt.plot([x0, x1], [y0, y0], [z0, z0], "-k", linewidth=0.5)
    plt.plot([x0, x1], [y1, y1], [z0, z0], "-k", linewidth=0.5)
    plt.plot([x0, x1], [y1, y1], [z1, z1], "-k", linewidth=0.5)
    plt.plot([x0, x1], [y0, y0], [z1, z1], "-k", linewidth=0.5)

    plt.plot([x0, x0], [y0, y1], [z0, z0], "-k", linewidth=0.5)
    plt.plot([x0, x0], [y0, y1], [z1, z1], "-k", linewidth=0.5)
    plt.plot([x1, x1], [y0, y1], [z1, z1], "-k", linewidth=0.5)
    plt.plot([x1, x1], [y0, y1], [z0, z0], "-k", linewidth=0.5)

    plt.plot([x0, x0], [y0, y0], [z0, z1], "-k", linewidth=0.5)
    plt.plot([x0, x0], [y1, y1], [z0, z1], "-k", linewidth=0.5)
    plt.plot([x1, x1], [y1, y1], [z0, z1], "-k", linewidth=0.5)
    plt.plot([x1, x1], [y0, y0], [z0, z1], "-k", linewidth=0.5)


def plot_lines_to_histograms(shift, x0, x1, y0, y1, z0,show_hist: bool = False, z_hist: bool = False):

    if not show_hist:
        shift = 0

    plt.plot([x0-shift, x0], [y0, y0], [z0, z0], "--k", linewidth=0.5)
    plt.plot([x0-shift, x0], [y1, y1], [z0, z0], "--k", linewidth=0.5)

    plt.plot([x0, x0], [y1, y1 + shift], [z0, z0], "--k", linewidth=0.5)
    plt.plot([x1, x1], [y1, y1 + shift], [z0, z0], "--k", linewidth=0.5)

    if z_hist:
        plt.plot([x0, x0], [y0, y0], [z0 - shift, z0], "--k", linewidth=0.5)
        plt.plot([x1, x1], [y0, y0], [z0 - shift, z0], "--k", linewidth=0.5)

    # Plot lines under histograms
    plt.plot([x0-shift, x0-shift], [y0, y1], [z0, z0], "--k", linewidth=0.5)
    plt.plot([x0, x1], [y1 + shift, y1 + shift], [z0, z0], "--k", linewidth=0.5)

    if z_hist:
        plt.plot([x0, x1], [y0, y0], [z0 - shift, z0 - shift], "--k", linewidth=0.5)


def generate_random_points(Np: int, option: str = "uniform", mu: float = 0.5, sigma: float = 0.12):

    np.random.seed(seed=0)

    if option.lower() == "uniform":
        # Uniform random
        x = np.random.random(Np)
        y = np.random.random(Np)
        z = np.random.random(Np)

    elif option.lower() == "sobol":
        # Sobol uniform
        sampler = qmc.Sobol(d=3, scramble=True)
        sobol = sampler.random(n=Np)
        x = sobol[:, 0]
        y = sobol[:, 1]
        z = sobol[:, 2]

    elif option.lower() == "normal":
        # Gaussian
        x = np.random.normal(mu, sigma, Np)
        y = np.random.normal(mu, sigma, Np)
        z = np.random.normal(mu, sigma, Np)

    elif option.lower() == "mixed":
        # Gaussian
        x = np.random.normal(mu, sigma, Np)
        y = np.random.normal(mu, sigma, Np)
        z = np.random.random(Np)

    else:
        raise NotImplementedError("Unimplemented Option")

    return x, y, z


def generate_secondary_points(Np: int):

    x = np.random.random(Np)
    y = np.random.random(Np)
    z = np.random.random(Np)

    return x, y, z


@dataclass
class Range:
    x: np.ndarray
    y: np.ndarray
    z: np.ndarray

    def __post_init__(self):

        self.min_x, self.max_x = np.min(self.x), np.max(self.x)
        self.min_y, self.max_y = np.min(self.y), np.max(self.y)
        self.min_z, self.max_z = np.min(self.z), np.max(self.z)
        self.x_range = self.max_x - self.min_x
        self.y_range = self.max_y - self.min_y
        self.z_range = self.max_z - self.min_z


@dataclass
class MinMax:
    xmin: float
    xmax: float
    ymin: float
    ymax: float
    zmin: float
    zmax: float


def arrange_ranges(x, y, z, rg: MinMax): #xmin: float = 0, xmax: float = 1, ymin: float = 0, ymax: float = 1, zmin: float = 0, zmax: float = 1):

    x = x * (rg.xmax - rg.xmin) + rg.xmin
    y = y * (rg.ymax - rg.ymin) + rg.ymin
    z = z * (rg.zmax - rg.zmin) + rg.zmin

    data = Range(x, y, z)

    return data


def plot_histograms(data, Np, nbins, rg, shift, ax, show_hist: bool = False, z_hist: bool = False):

    if show_hist:

        y, x = np.histogram(data.x, bins=np.linspace(data.min_x, data.max_x, nbins))
        x = x[:-1]
        y = y / Np
        dx = data.x_range / (nbins - 1)
        ax.bar(x + dx/2, y, width=dx, edgecolor="black", linewidth=0.7, zdir="y", alpha=0.3, zs=rg.ymax + shift)
        ax.set_xlabel("x")

        y, x = np.histogram(data.y, bins=np.linspace(data.min_y, data.max_y, nbins))
        x = x[:-1]
        y = y / Np
        dx = data.y_range / (nbins - 1)
        ax.bar(x + dx/2, y, width=dx, edgecolor="black", linewidth=0.7, zdir="x", alpha=0.3, zs=rg.xmin - shift)
        ax.set_ylabel("y")
        ax.set_zlabel("z")

        if z_hist:
            # This doesn't work as i wanted
            y, x = np.histogram(data.z, bins=np.linspace(data.min_z, data.max_z, nbins))
            x = x[:-1]
            y = y / Np
            dx = data.z_range / (nbins - 1)
            # print(f'z_range: {z_range} dx: {dx}')
            # ax.bar(x + dx/2, y, width=dx, edgecolor="white", linewidth=0.7, zdir="z", alpha=0.6, zs=ymax)
            ax.bar(x + dx/2, y, width=dx, zs=rg.zmin-shift, edgecolor="white", linewidth=0.7, zdir="z", alpha=0.6, )
            ax.set_xlabel("z")

    # ax.set_xlim([xmin, xmax])
    # ax.set_ylim([ymin, ymax])
    # ax.set_zlim([zmin, zmax]);
    ax.set_xlim([rg.xmin - shift, rg.xmax])
    ax.set_ylim([rg.ymin, rg.ymax + shift])
    if z_hist:
        ax.set_zlim([rg.zmin - shift, rg.zmax])
    else:
        ax.set_zlim([rg.zmin, rg.zmax])

    ax.set_xticklabels([])
    ax.set_yticklabels([])
    ax.set_zticklabels([])

    ax.set_axis_off()

    # ax.view_init(elev=30, azim=45)
    # ax.view_init(elev=30, azim=0)
    # ax.view_init(elev=30, azim=90)
    # ax.view_init(azim=-90, elev=0)
    # ax.view_init(azim=-0, elev=0)
    # ax.view_init(azim=-90, elev=90)

    return


@dataclass
class Settings:
    Np: int
    Np2: int
    shift: float # Shift amount for the histograms
    nbins: int

def main():

    settings = Settings(Np=1000, Np2=10, shift=0.3, nbins=10)
    rg = MinMax(xmin=0, xmax=1, ymin=0, ymax=1, zmin=0, zmax=1)
    z_hist = False  # Show z-histogram
    z_hist = True
    show_hist = True
    show_second_set = False

    # x_inp, y_inp, z_inp = generate_random_points(settings.Np, option="normal")
    # x_inp, y_inp, z_inp = generate_random_points(settings.Np, option="mixed")
    # x_inp, y_inp, z_inp = generate_random_points(settings.Np, option="sobol")
    x_inp, y_inp, z_inp = generate_random_points(settings.Np, option="uniform")

    x_inp2, y_inp2, z_inp2 = generate_secondary_points(settings.Np2)

    data = arrange_ranges(x_inp, y_inp, z_inp, rg) #xmin=xmin, xmax=xmax, ymin=ymin, ymax=ymax, zmin=zmin, zmax=zmax)
    data2 = arrange_ranges(x_inp2, y_inp2, z_inp2, rg) #xmin=xmin, xmax=xmax, ymin=ymin, ymax=ymax, zmin=zmin, zmax=zmax)


    fig= plt.figure(figsize=(12, 8))
    ax = Axes3D(fig)
    ax.scatter(data.x, data.y, data.z)
    if show_second_set:
        ax.scatter(x_inp2, y_inp2, z_inp2, color='r', marker="o", s=60)

    plot_histograms(data, settings.Np, settings.nbins, rg, settings.shift, ax, show_hist=show_hist, z_hist=z_hist)

    plot_x_and_y_place_surfaces(1, 1, 1, ax, alpha=0.05)
    plot_rectangle_border_lines(0,1, 0,1, 0,1)

    plot_lines_to_histograms(settings.shift, 0, 1, 0, 1, 0, show_hist=show_hist, z_hist=z_hist)

    # ax.view_init(elev=30, azim=45)

    save_figs = False
    # save_figs = True

    i = 2
    if save_figs:
        # plot_me(proj_type= "ortho")
        save_snapshots_to_file(save_figs=save_figs, filename=f"3daxes_2d_histogram{i:0>4}.png")
        # plt.show()
    else:
        # plt.show()
        auto_close_matplotlib_plots()


if __name__ == "__main__":
    main()
